When politicians proselytize on the needs of the middle class but don’t mention the racial wealth gap or homeownership rates—issues interrelated to Black voters’ class status and political interests—they are signaling they are only talking to the white middle class. As our colleagues Richard V. Reeves and Camille Busette pointed out in a 2018 report, “the term ‘American middle class,’ while not historically and intentionally located in a discourse about race, has always inherently been about race, specifically about white Americans.” . . .
MEASURING THE BLACK MIDDLE CLASS
Using American Community Survey 5-year Estimates for 2013 to 2017, this report adjusts the income quintiles in combination with the Tax Policy Center’s Household Income Quintiles to get the most accurate yearly income accounting for the Black middle class. We also examined their careers and presence in metropolitan areas.
While there are many definitions for the “middle class,” this report will use the Brookings Future of the Middle Class Initiative’s definition: the middle 60% of households on the income distribution. By that measurement, middle-class families had incomes between $22,000 and $125,000 in the years (2013 to 2017) studied. Black people represent about 13% of the U.S. population, 61.2% of which are middle class.
This analysis follows the Metropolitan Policy Program’s previous approach to income threshold adjustments for the middle class across regions. After the national income thresholds are determined, they are adjusted based upon two characteristics: First, the Bureau of Economic Analysis’s regional price parities, which measure the differences in price levels across metro areas and vary from a baseline of 100, from 81 (in Jefferson City, Mo.) to 131 (in San Jose, Calif.). Second, they are adjusted by household size, which influences the resources available per person.[1]
WHERE THE BLACK MIDDLE CLASS LIVES
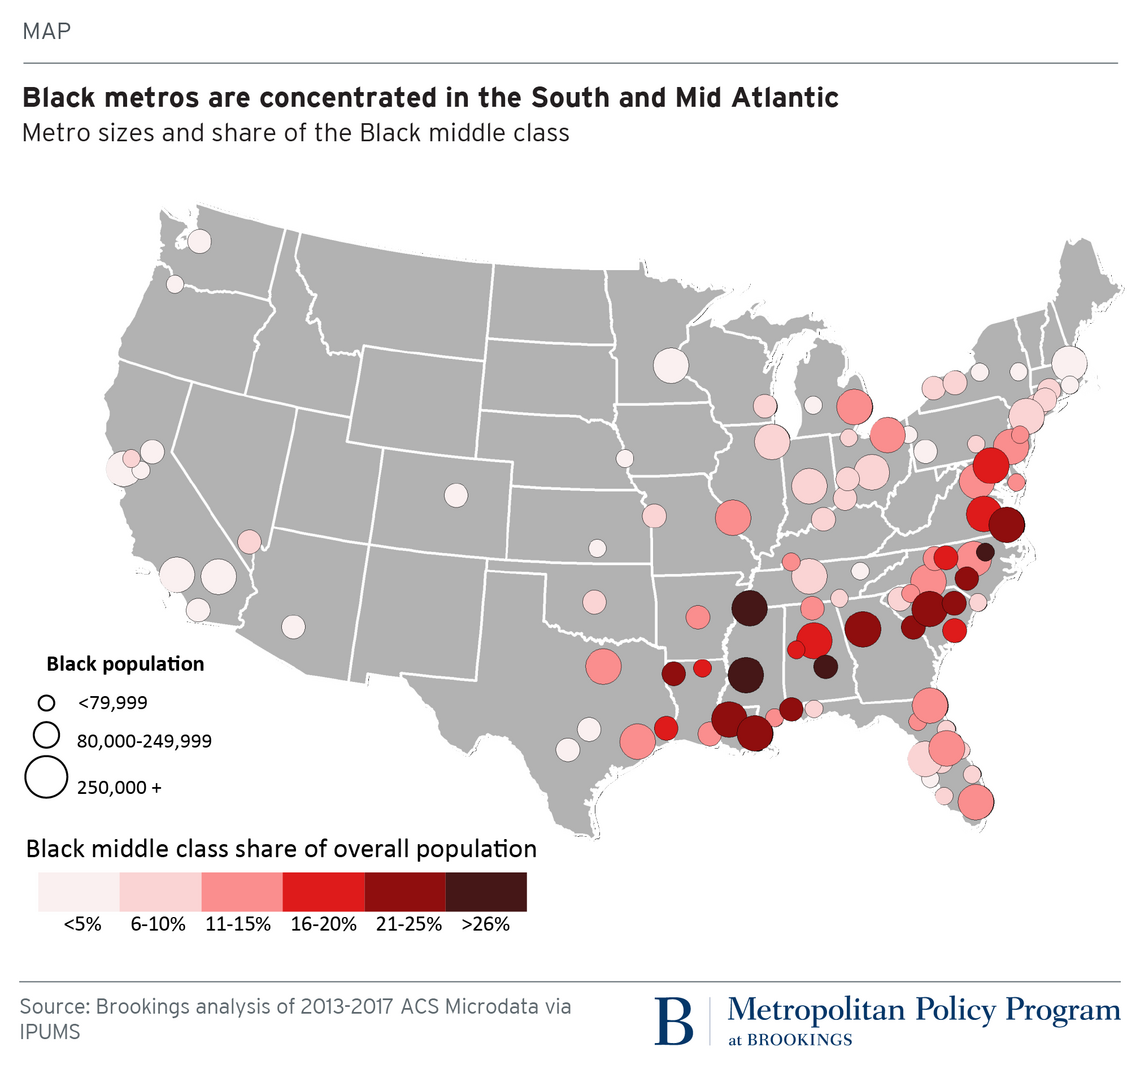
The above map includes the 100 metro areas with the largest Black population. The smallest circles represent metropolitan areas with fewer than 80,000 people in the Black population, medium circles represent areas with 80,000 to 250,000 people in the Black population, and the largest circles represent areas with more than 250,000 people in the Black population.
The hue of the circle indicates the percentage of the overall population belonging to the Black middle class. Metropolitan areas with a large Black population but a small percentage of the overall population in the Black middle class—such as Los Angeles—are large circles with the lightest hue. Metropolitan areas with a small Black population but a higher percentage of the overall population in the Black middle class—such as Rocky Mount, N.C.—are small circles with the darkest hue.
The Black middle class is concentrated largely in the South and in large metro areas, in contrast to the small heartland towns evoked by standard middle-class rhetoric. Therefore, strengthening the Black middle class means strengthening the South. While there are several metro areas in the West, Midwest, and Northeast that have Black populations greater than 250,000, Detroit, Cleveland, and St. Louis are the only ones outside of the South and Mid-Atlantic that have a share of the Black middle class greater than 10% of their overall populations.
There are metropolitan areas with smaller shares of Black middle-class families compared to the overall population, such as the Portland, Ore. metro area, which has a Black middle-class population of 1.4%. Some metropolitan areas have a plurality of their population in the Black middle class, such as Jackson, Miss., with a Black middle-class population share of 29.3%.
While political discussions of the middle class are often centered around the imagery of small towns and rural America, only 13.2% of the Black middle class lives in metropolitan areas classified as small (fewer than 200,000 residents). Conversely, large metropolitan areas (more than 500,000 residents) house 77.3% of the Black middle class, with the remaining 9.4% in medium-sized metropolitan areas (200,000 to 500,000 residents). Prior Brookings research on the rise in the number of Black-majority cities helps explain how intra-metropolitan migration since 1970 has shifted demographics between these areas.
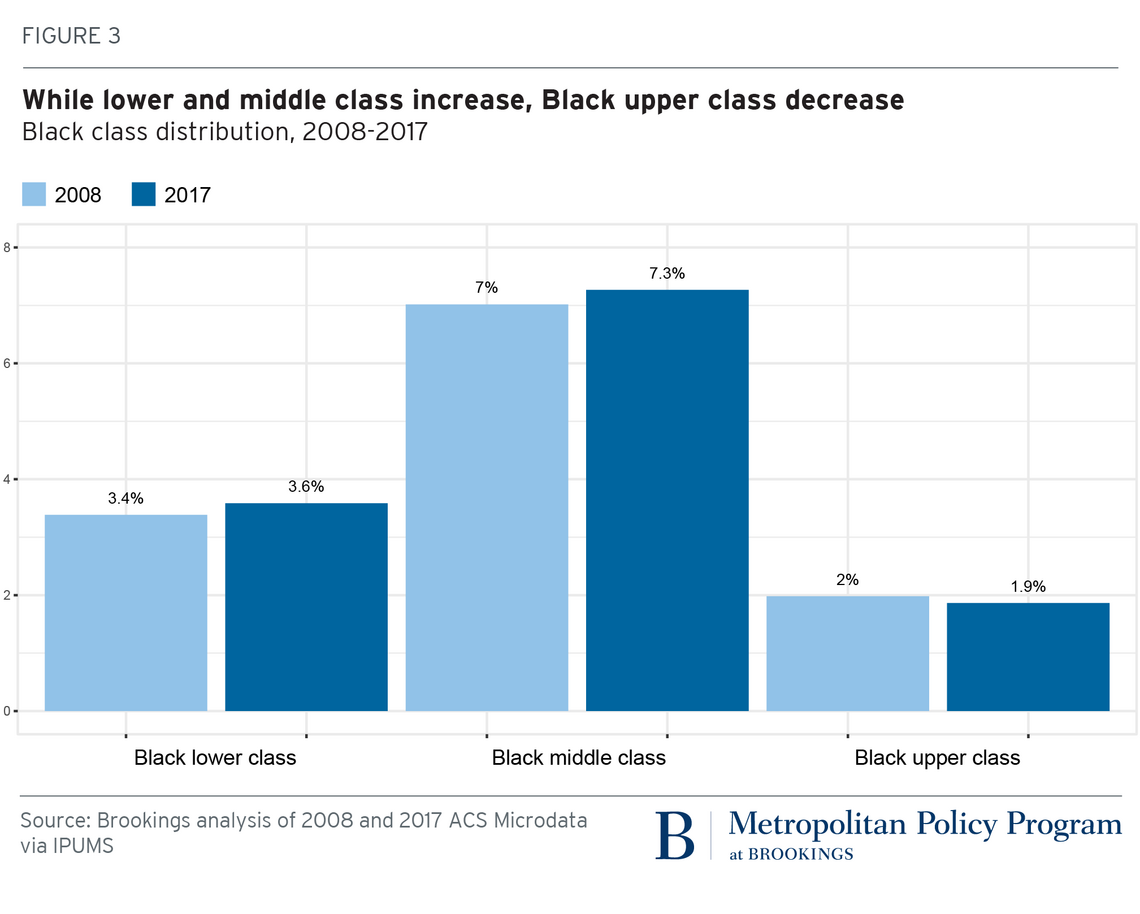
The Black middle class is growing. From 2008 to 2017, the percentage of the Black population in the middle class as a share of the overall population increased across the country, with a simultaneous rise in the Black working class and decline in the Black upper class. The decline of the Black upper class and increase in the Black working class should complicate current political discourse on how full employment leads to higher wages for Black workers. This report does not examine these changes, but future exploration of these topics is certainly warranted.
WHERE THE BLACK MIDDLE CLASS WORKS
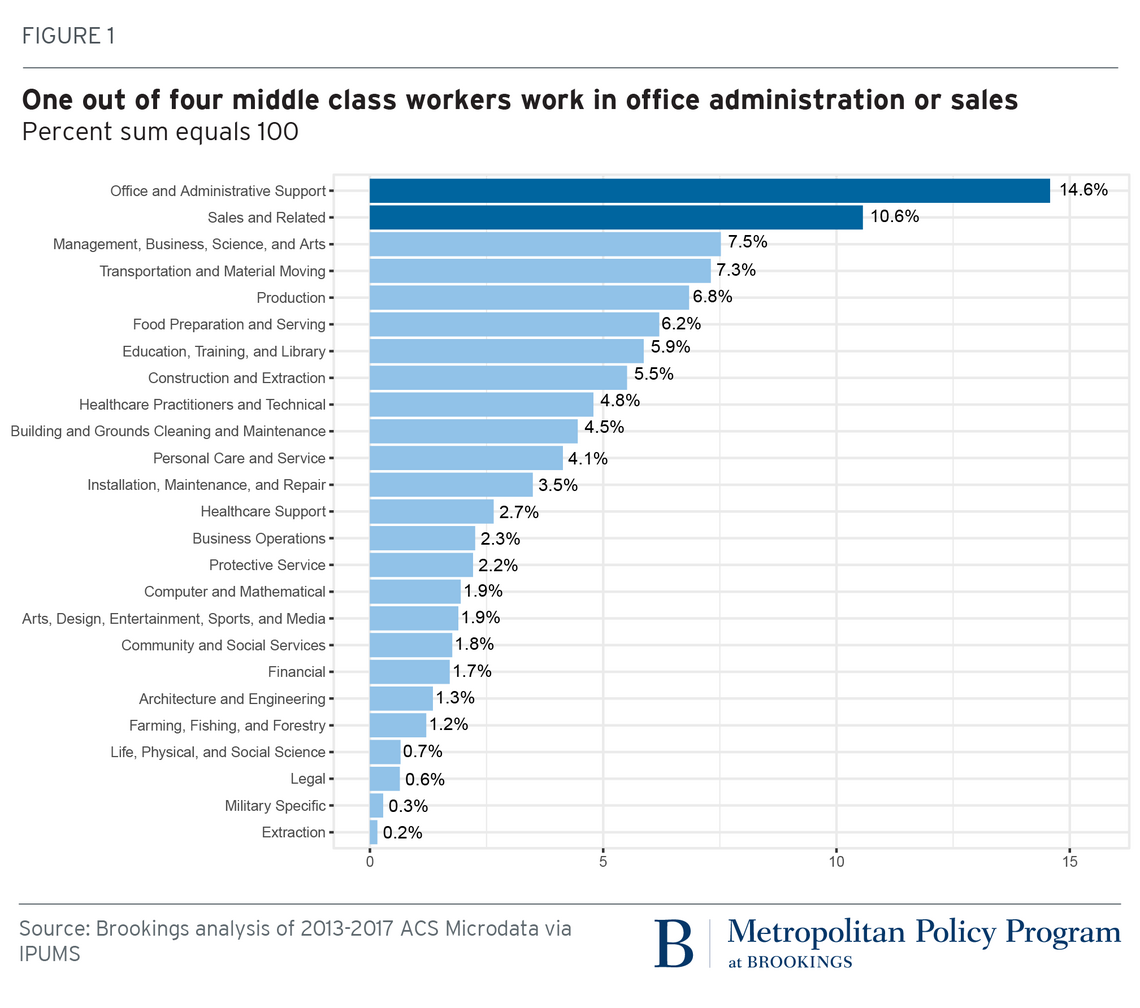
One out of four middle-class workers of all races are employed in office and administrative jobs and sales positions. Figure 2 shows the percentage of middle-class workers in various occupation categories. . . .
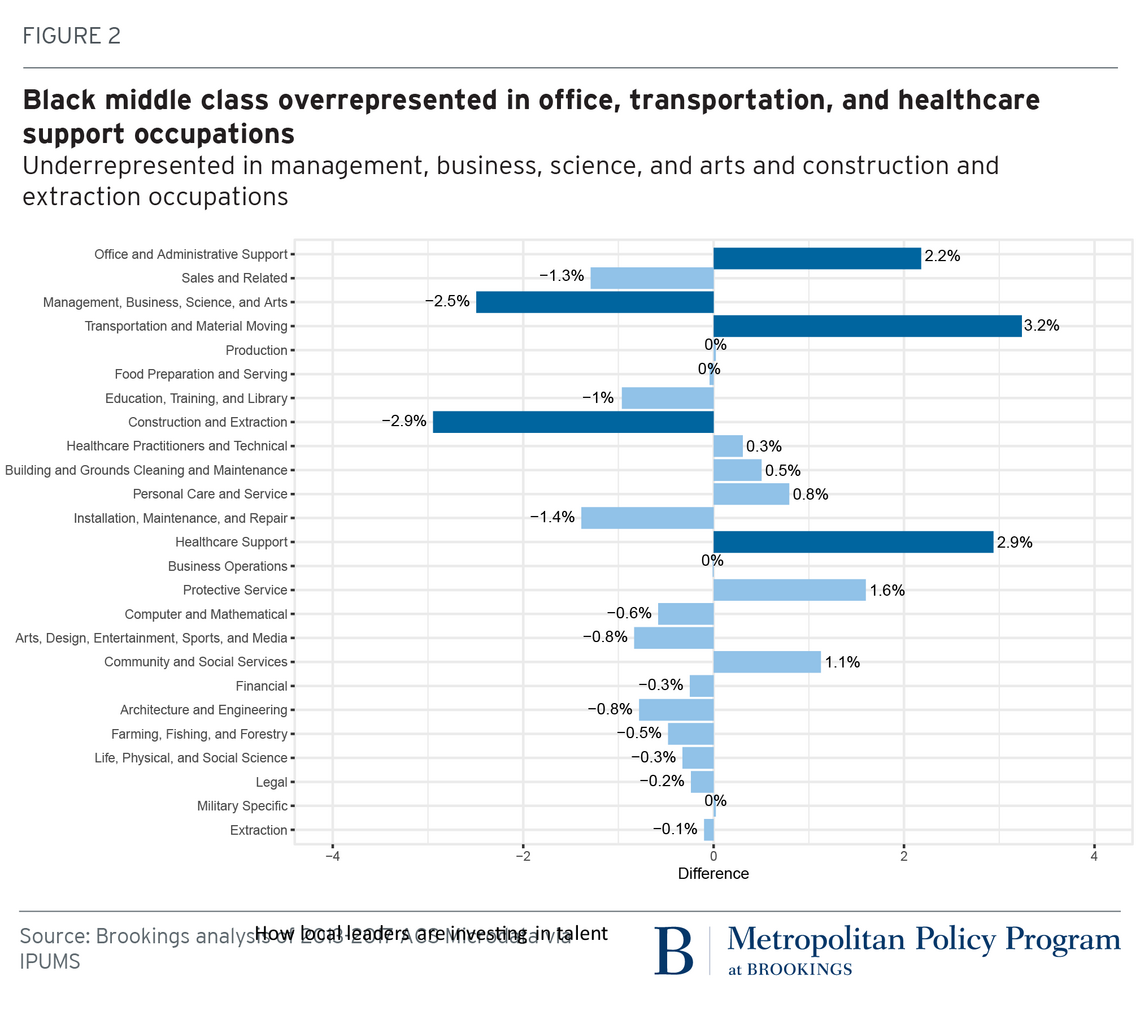
According to our analysis of Census Bureau data, as seen in Figure 3, the Black middle class is overrepresented in office and administrative support, transportation and material moving occupations, health care support occupations, protective service occupations, and community and social service occupations. The Black middle class is underrepresented in managerial, business, science, arts, design, entertainment, sports, and media occupations, as well as architecture and engineering occupations. This chart shows the occupations held by the middle class, regardless of other sources of income.[2] . . .
While there is no crystal ball to tell us what jobs will be created in the future and what skills will be rendered obsolete, we know that those who have more wealth will have a greater capacity to adapt to shifts in the labor market. Black middle-class families deserve specific policy attention in this regard, due to significant racial differences in wealth distribution and those families’ subsequent vulnerability in the job market.
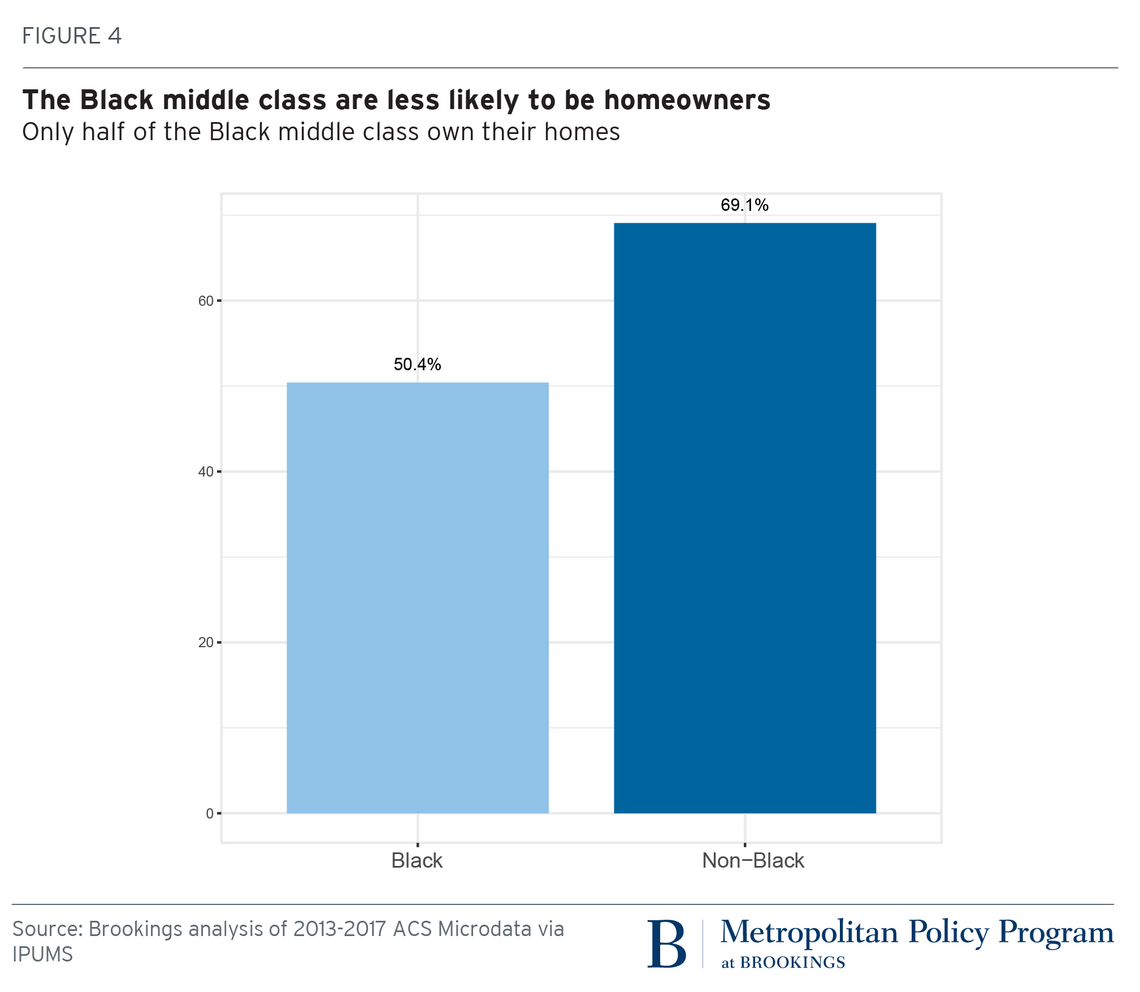
One area where this racial difference in wealth distribution is acute is the Black homeownership gap. The Black middle class has lower homeownership rates compared to the rest of the middle class—only half are homeowners, compared to 69% of their peers.
Homeownership rates among Black middle-class families vary across metro areas. One constant is in the South, where the Black middle class boasts higher homeownership rates compared to the rest of the U.S.
The size of the metro area also matters when it comes to Black homeownership rates. After adjusting for family sizes and local middle-class thresholds, Black middle-class families have lower homeownership rates in large metro areas (where a disproportionate share of the Black middle class lives) than in small metro areas. In Wenatchee, Wash. (the metro area with both the lowest percentage and lowest absolute number of residents in the Black middle class), there is a 100% homeownership rate for the Black middle class. Bismarck, N.D., has the lowest homeownership rate for the Black middle class, at 11.1%.
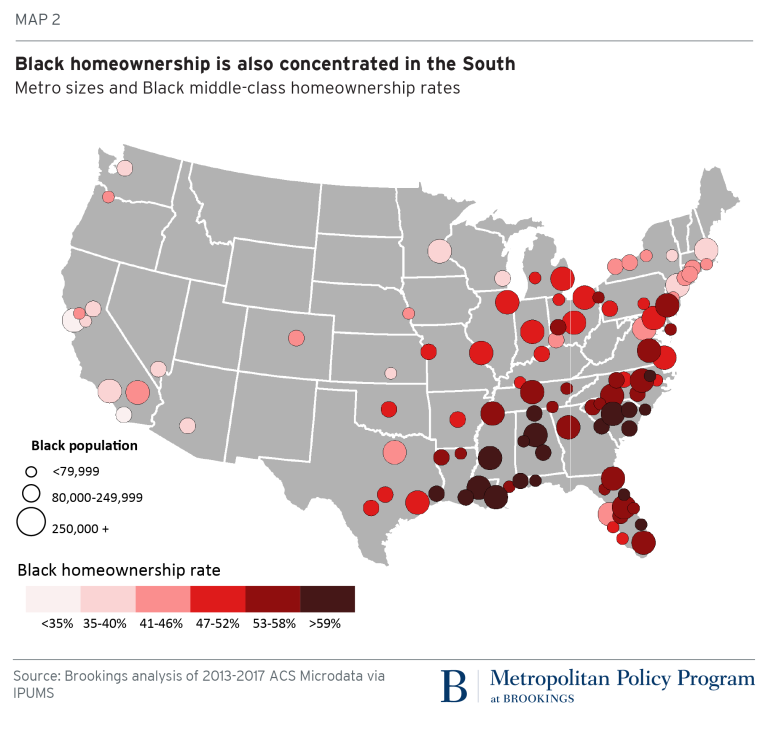
The preceding map includes the 100 metro areas with the largest Black population. The smallest circles represent metropolitan areas with fewer than 80,000 people in the Black population, medium circles represent areas with 80,000 to 250,000 people in the Black population, and the largest circles represent areas with more than 250,000 people in the Black population. The hue of the circle indicates the percentage of the Black middle class that are homeowners. Metropolitan areas with a large Black population but a small percentage of homeowners—such as San Francisco—are large circles with the lightest hue. Metropolitan areas with a small Black population but a high percentage of homeowners—such as Daytona Beach, Fla.—are small circles with the darkest hue. . . .
Endnotes
- In order to protect privacy in the American Community Survey, individuals are listed by Public Use Microdata Area (PUMA). While most PUMAs often nest within metro areas, there are some small matching errors; these are errors of omission (residents of a metropolitan area who are not identified as residents) and errors of commission (nonresidents who are identified as residents). For some metro areas, particularly smaller ones, intersecting PUMAs are a poor match and are listed as unidentifiable when the sum of match errors is 15% or more.
- To explore the difference between the Black middle class and other racial groups, this report uses a leave-one-out mean, wherein the share of the Black middle class in specific occupations is calculated, and then the share of the entire middle class except the Black middle class is calculated. Then, the share of everyone except the Black middle class is subtracted from the Black middle class for each occupation. The result is a distribution of numbers that shows where the Black middle class is overrepresented (a positive number), underrepresented (a negative number), or representative (0). Occupations that are over- or under-representative of the Black middle class by greater than 2% are shaded in dark blue while relatively representative occupations are shaded in light blue.
Source: Andre M. Perry and Carl Romer, “The Black Middle Class Needs Political Attention, Too,” February 27, 2020, Brookings Institution.