Primary Sources
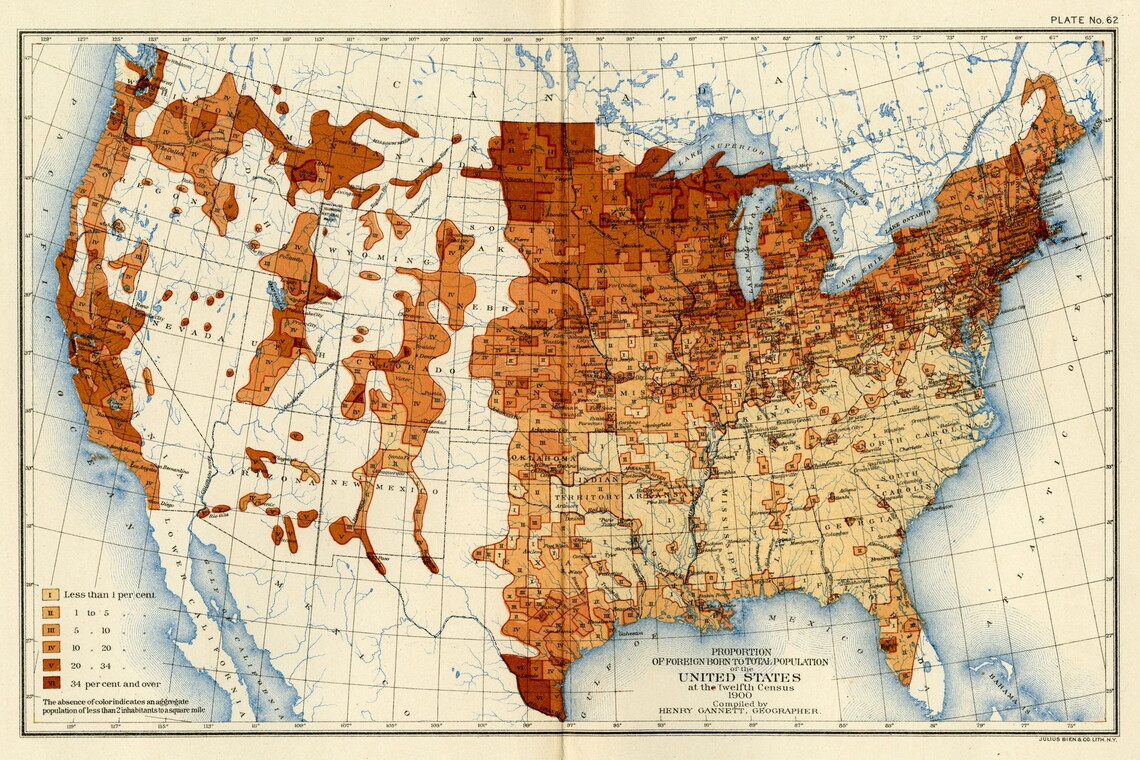
Henry Gannett, “Proportion of Foreign Born to Total Population of the United States at the Twelfth Census 1900,” 1900 (The Gilder Lehrman Institute of American History)
State of Residence
Foreign-Born Population of the United States by State of Residence
| State or Territory | Total Population | Foreign Born Population |
Percentage of Population That Was Foreign Born
|
|---|---|---|---|
| Alabama | 1,828,697 | 14,592 | 0.80% |
| Alaska | 63,592 | 12,661 | 19.90% |
| Arizona | 122,931 | 24,233 | 19.70% |
| Arkansas | 1,311,564 | 14,289 | 1.10% |
| California | 1,485,053 | 367,240 | 24.70% |
| Colorado | 539,700 | 91,155 | 16.90% |
| Connecticut | 908,420 | 238,210 | 26.20% |
| Delaware | 184,735 | 13,810 | 7.50% |
| District of Columbia | 278,718 | 20,119 | 7.20% |
| Florida | 528,542 | 23,832 | 4.50% |
| Georgia | 2,216,331 | 12,403 | 0.60% |
| Hawaii | 154,001 | 90,780 | 58.90% |
| Idaho | 161,772 | 24,604 | 15.20% |
| Illinois | 4,821,550 | 966,747 | 20.10% |
| Indiana | 2,516,462 | 142,121 | 5.60% |
| Indian Territory | 392,060 | 4,858 | 1.20% |
| Iowa | 2,231,853 | 305,920 | 13.70% |
| Kansas | 1,470,495 | 126,685 | 8.60% |
| Kentucky | 2,147,174 | 50,249 | 2.30% |
| Louisiana | 1,381,625 | 52,903 | 3.80% |
| Maine | 694,466 | 93,330 | 13.40% |
| Maryland | 1,188,044 | 93,934 | 7.90% |
| Massachusetts | 2,805,346 | 846,324 | 30.20% |
| Michigan | 2,420,982 | 541,653 | 22.40% |
| Minnesota | 1,751,394 | 505,318 | 28.90% |
| Mississippi | 1,551,270 | 7,981 | 0.50% |
| Missouri | 3,106,665 | 216,379 | 7% |
| Montana | 243,329 | 67,067 | 27.60% |
| Nebraska | 1,066,300 | 177,347 | 16.60% |
| Nevada | 42,335 | 10,093 | 23.80% |
| New Hampshire | 411,588 | 88,107 | 21.40% |
| New Jersey | 1,883,669 | 431,884 | 22.90% |
| New Mexico | 195,310 | 13,625 | 7% |
| New York | 7,268,894 | 1,900,425 | 26.10% |
| North Carolina | 1,893,810 | 4,492 | 0.20% |
| North Dakota | 319,146 | 113,091 | 35.40% |
| Ohio | 4,157,545 | 458,734 | 11% |
| Oklahoma | 398,331 | 15,680 | 3.90% |
| Oregon | 413,536 | 65,748 | 15.90% |
| Pennsylvania | 6,302,115 | 985,250 | 15.60% |
| Rhode Island | 428,556 | 134,519 | 31.40% |
| South Carolina | 1,310,316 | 5,528 | 0.40% |
| South Dakota | 401,570 | 88,508 | 22% |
| Tennessee | 2,020,616 | 17,746 | 0.90% |
| Texas | 3,048,710 | 179,357 | 5.90% |
| Utah | 276,749 | 53,777 | 19.40% |
| Vermont | 343,641 | 44,747 | 13% |
| Virginia | 1,854,184 | 19,461 | 1% |
| Washington | 518,103 | 111,364 | 21.50% |
| West Virginia | 958,800 | 22,451 | 2.30% |
| Wisconsin | 2,069,042 | 515,971 | 24.90% |
| Wyoming | 92,531 | 17,415 | 18.80% |
| Servicemen Stationed Oversees | 91,219 | 15,368 | 16.80% |
| Total | 76,273,387 | 10,460,085 | 13.70% |
Census Reports Volume 1. Twelfth Census of the United States Taken in the Year 1900. Population Part 1 (Washington, United States Census Office, 1901)
Country of Origin
Foreign-Born Population of the United States by Country of Origin
| Country of Migration |
Number of Immigrants
|
|---|---|
| Africa | 2,577 |
| Asia (except China, Japan, and India) | 11,928 |
| Atlantic Islands | 10,955 |
| Australia | 7,041 |
| Austria | 276,702 |
| Belgium | 29,848 |
| Bohemia | 156,999 |
| Canada | 1,183,225 |
| Central America | 3,911 |
| China | 106,659 |
| Cuba | 11,159 |
| Denmark | 154,616 |
| England | 843,491 |
| Europe (Not otherwise specified) | 2,272 |
| Finland | 63,440 |
| France | 104,534 |
| Germany | 2,669,164 |
| Greece | 8,655 |
| Holland | 105,098 |
| Hungary | 145,815 |
| India | 2,069 |
| Ireland | 1,619,469 |
| Italy | 484,703 |
| Japan | 81,590 |
| Luxemburg | 3,042 |
| Mexico | 103,445 |
| Norway | 338,426 |
| Pacific Islands | 2,659 |
| Poland | 383,645 |
| Portugal | 37,144 |
| Romania | 15,043 |
| Russia | 424,372 |
| Scotland | 234,699 |
| South America | 4,814 |
| Spain | 7,284 |
| Sweden | 574,625 |
| Switzerland | 115,959 |
| Turkey | 9,949 |
| Wales | 93,744 |
| West Indies | 14,468 |
| Other countries (Not otherwise specified) | 2,587 |
| Born at Sea | 8,310 |
| 10,460,135 |
Census Reports Volume 1. Twelfth Census of the United States Taken in the Year 1900. Population Part 3 (Washington, United States Census Office, 1901)